GA4 Reporting Quirks Explained!


You may have noticed that after you set up the new GA4 integration, reporting doesn't quite look the same as in Universal Analytics... What's going on!?!
In Universal Analytics, you were able to drag the 6sense Custom Dimensions into reports to see the individual counts by Company Name, for example.
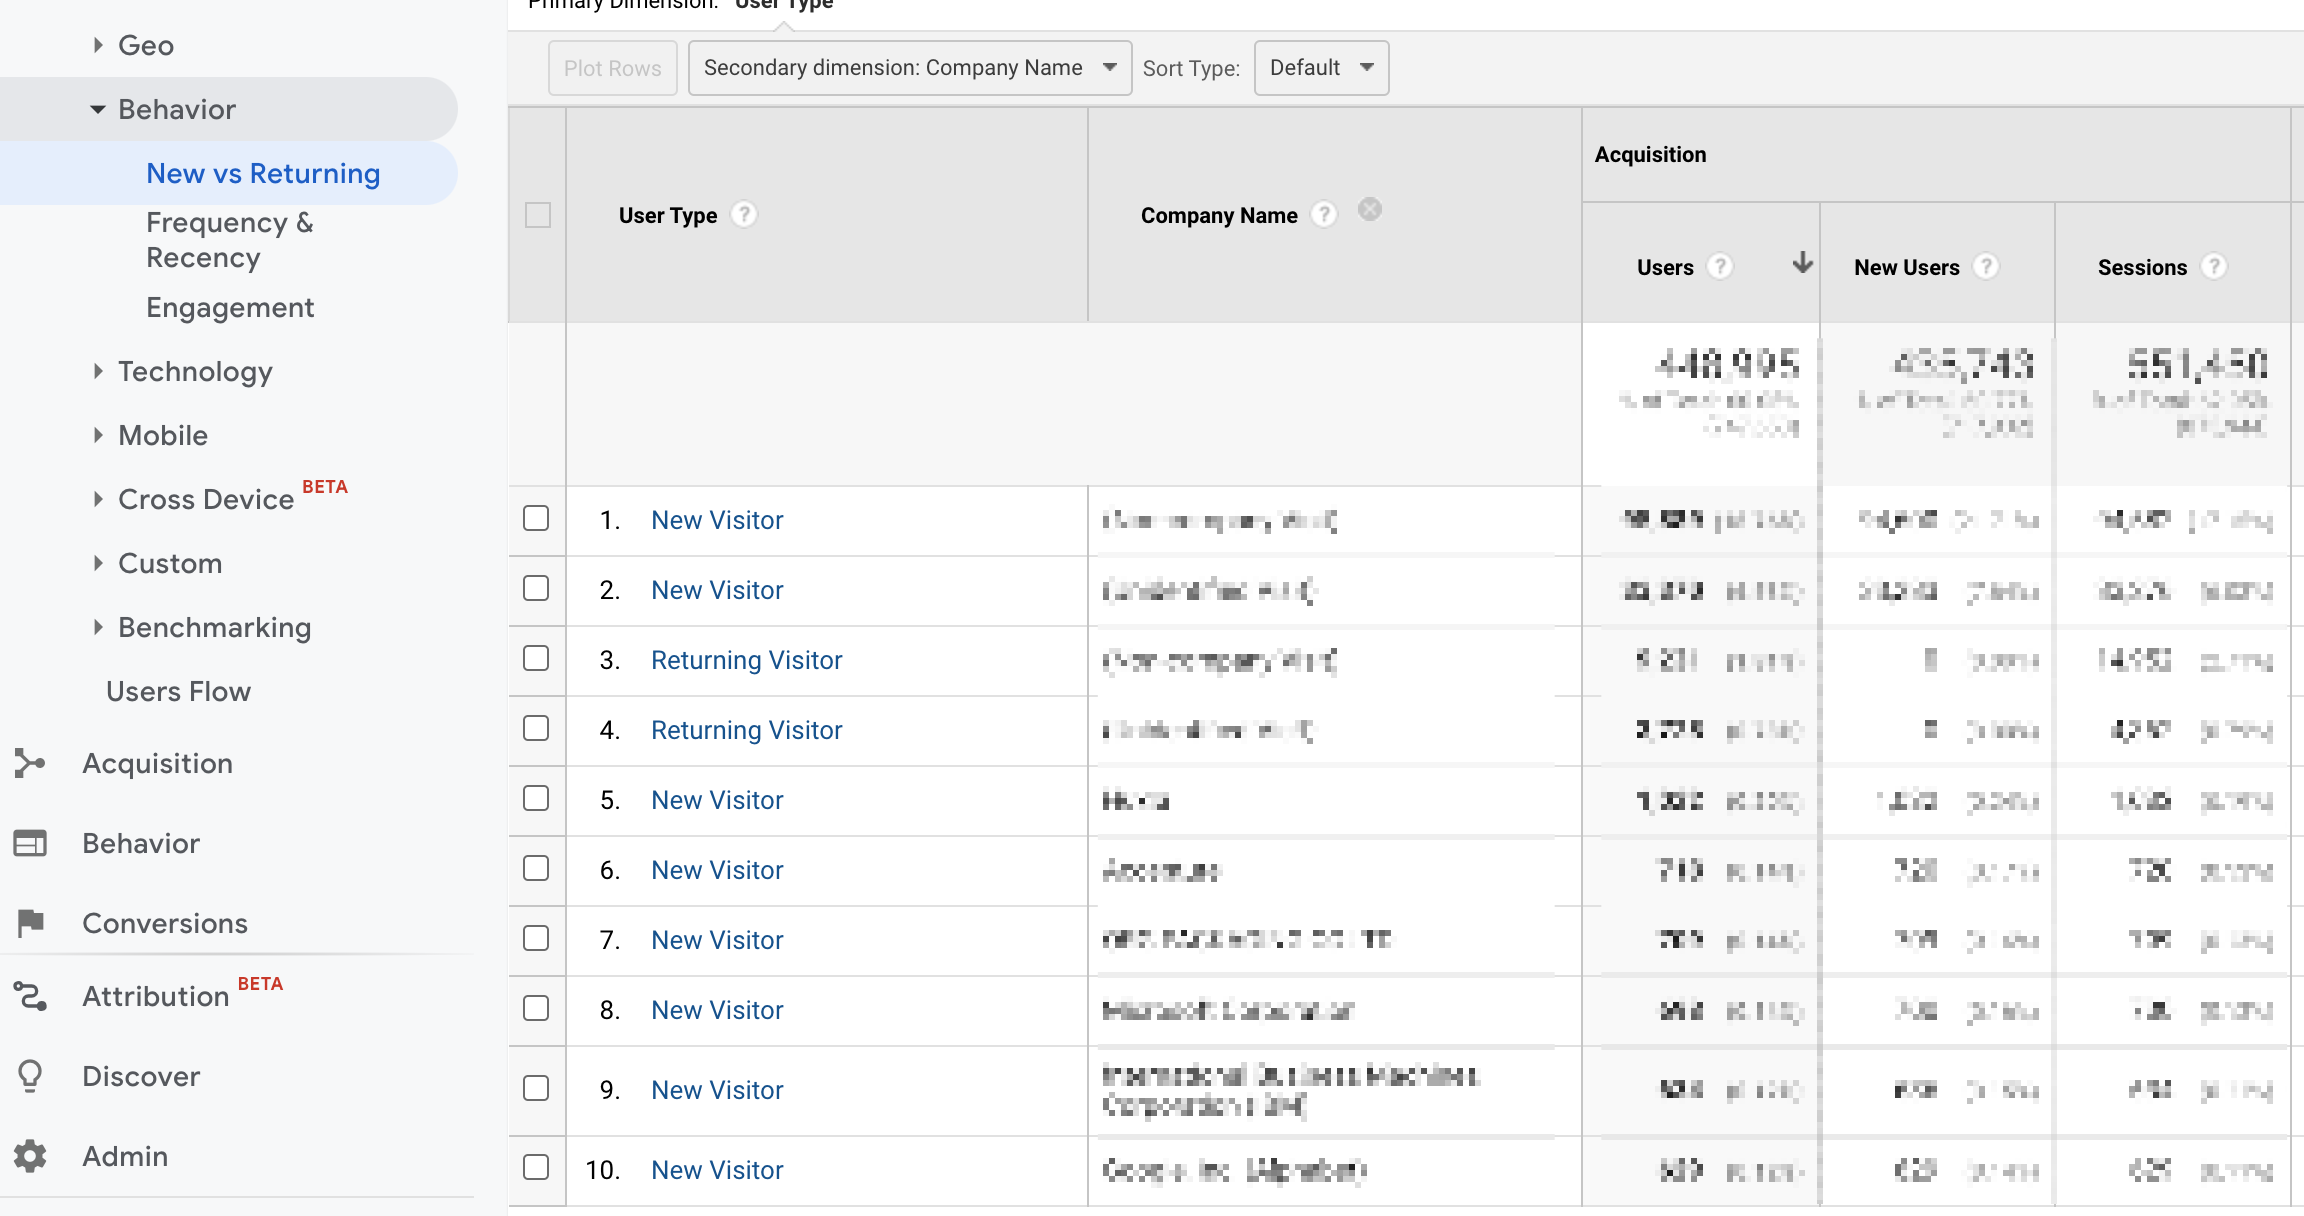
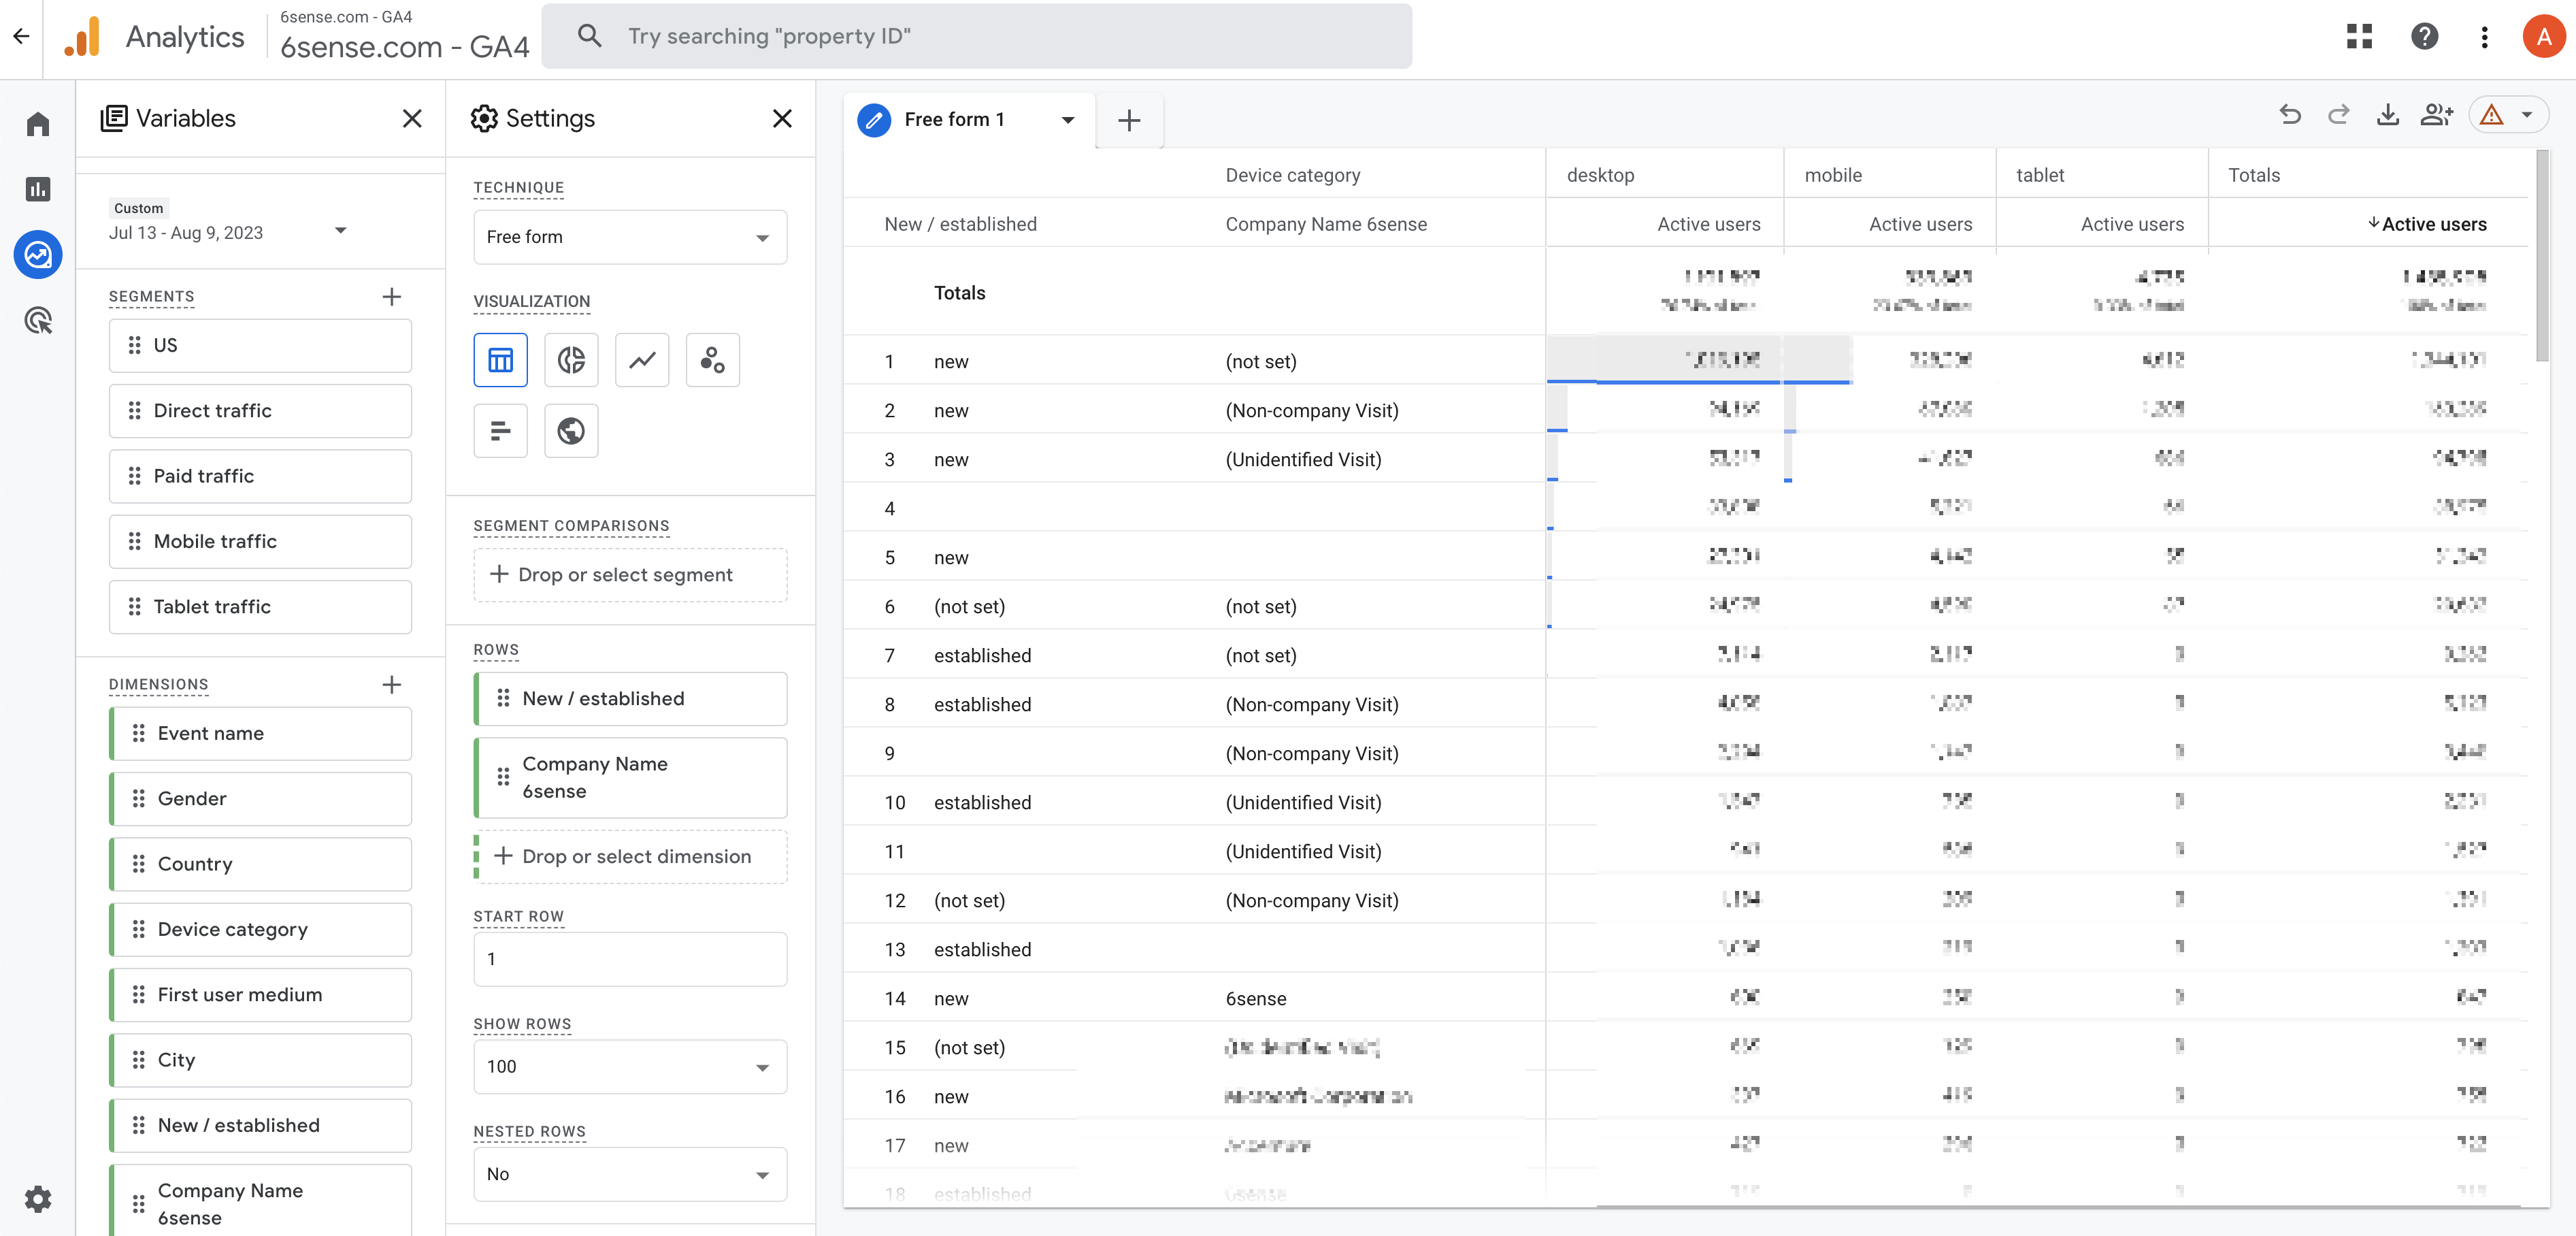
Now, in GA4, you might notice that a similar report shows fewer Company Names and a lot more "(not set)" values.
Why is that?
Well, in GA4, Google has taken steps to stay privacy-compliant while still providing Demographic dimensions and the ability to sync Audiences with Google AdWords. It's called Thresholding and, unfortunately, it means that Custom Dimensions in GA4 are significantly more limited than in Universal Analytics.
What is Thresholding?
According to Google:
If your report or exploration is missing data, it may be because Google Analytics has applied a data threshold. Data thresholds are applied to prevent anyone viewing a report or exploration from inferring the identity of individual users based on demographics, interests, or other signals present in the data.
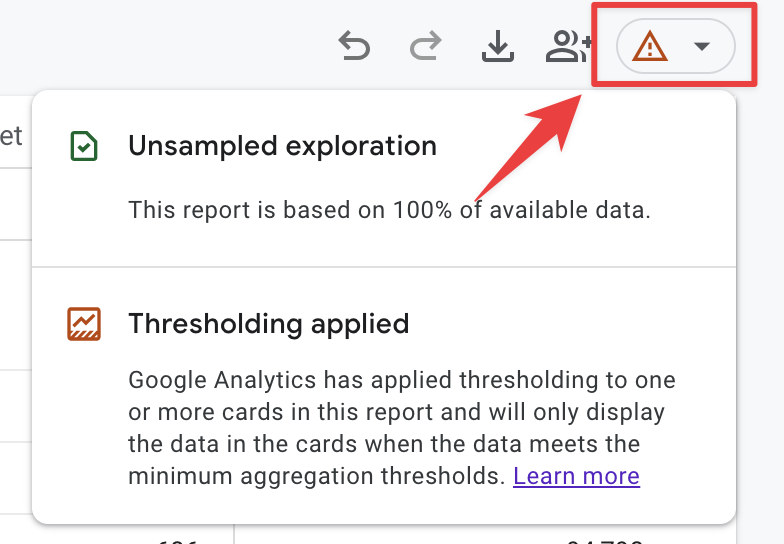
How can you tell if Thresholding is limiting your reporting ability? There will be a warning indicator at the top of your report.
But why is Google doing this to us?
Well, imagine you have a report where you are reporting on geographic location and company name. Let's say 6sense identified a company with 5 total employees, each of which lives in a different US state. Well, with geographic location and 6sense data, a report viewer could determine exactly where the individual's working for that company are located. This, unfortunately, is a violation of Google's latest privacy standards and thus they have taken the extra precaution to not allow this kind of reporting.
How can I use 6sense data in GA4 now?
Well, using 6sense data in Audiences is the recommended option. Given the Audience reaches a size above the data threshold limits (these limits, by the way, are purposefully not explicitly told by Google, but we can estimate it's somewhere between 100 and 500 users), then this Audience can be used in report Comparisons and in syncing to other Google properties like AdWords.
So, how can I confirm everything is working properly in GA4 then? And how can I see what the "Match Rate" is?
First, before we dive into the steps, let's cover why there are some good reasons why a Match Rate seen in GA4 might be different than the Match Rate seen in 6sense.
If you're at this point in the article, you've likely already done the full Google Tag Manager and GA4 set-up, so you know personally how many moving pieces there are to get the 6sense data over to GA4.
First, a website visitor needs to be using a web browser without any Google Analytics blocking extensions and visit your website for enough time for the 6sense API to fire and for GTM to pick up that data. Some web visitors, unfortunately, bounce from the page very quickly before GA4 can get the data.
Now, if you've set up the 6sense WebTag to fire ASAP as recommended, it may pick up that visitor page view signal before the visitor leaves the page before the 6sense API could return data. This means you see the web data in 6sense but not in GA4!
OK, OK, How do I see the match rate?
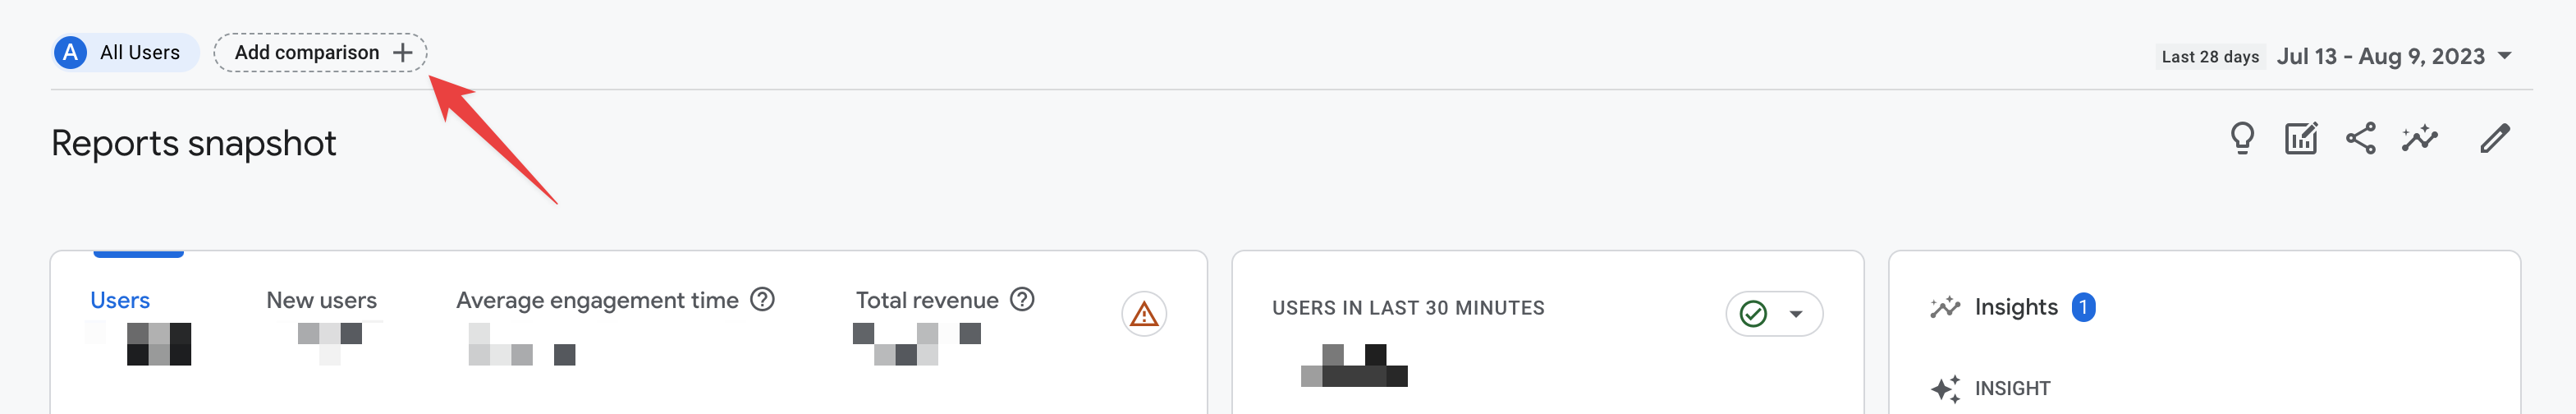
To check out the match rate realized in GA4, create a "Comparison." You could also create an Audience to do the same thing. For our purposes here, Comparisons involve less steps, so we'll cover that.
At the top of most reports there will be an oval to click where you can "Add comparison."
Click that, and a pane to the right will open. Select the "Match Indicator" custom dimension you set up and select all the options then click Apply.
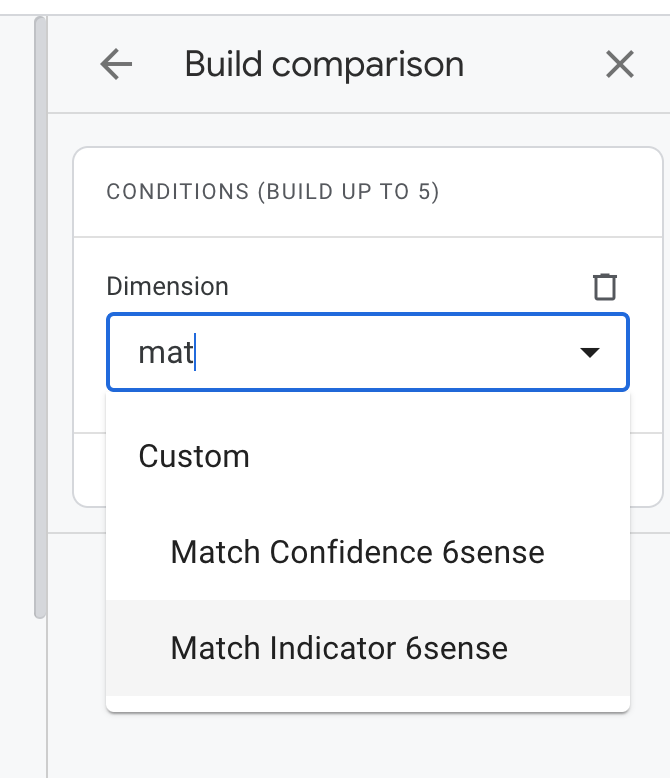
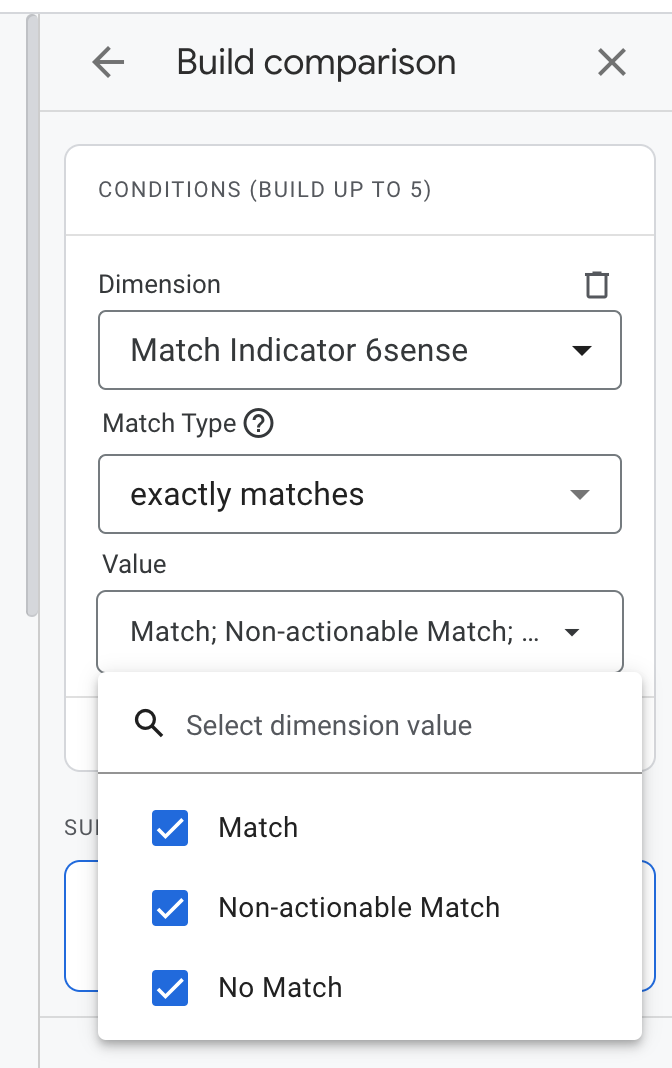
Add another comparison, and select the same Match Indicator dimension but only select "Match."
In your report, now you can see the overall trend between the two groups.
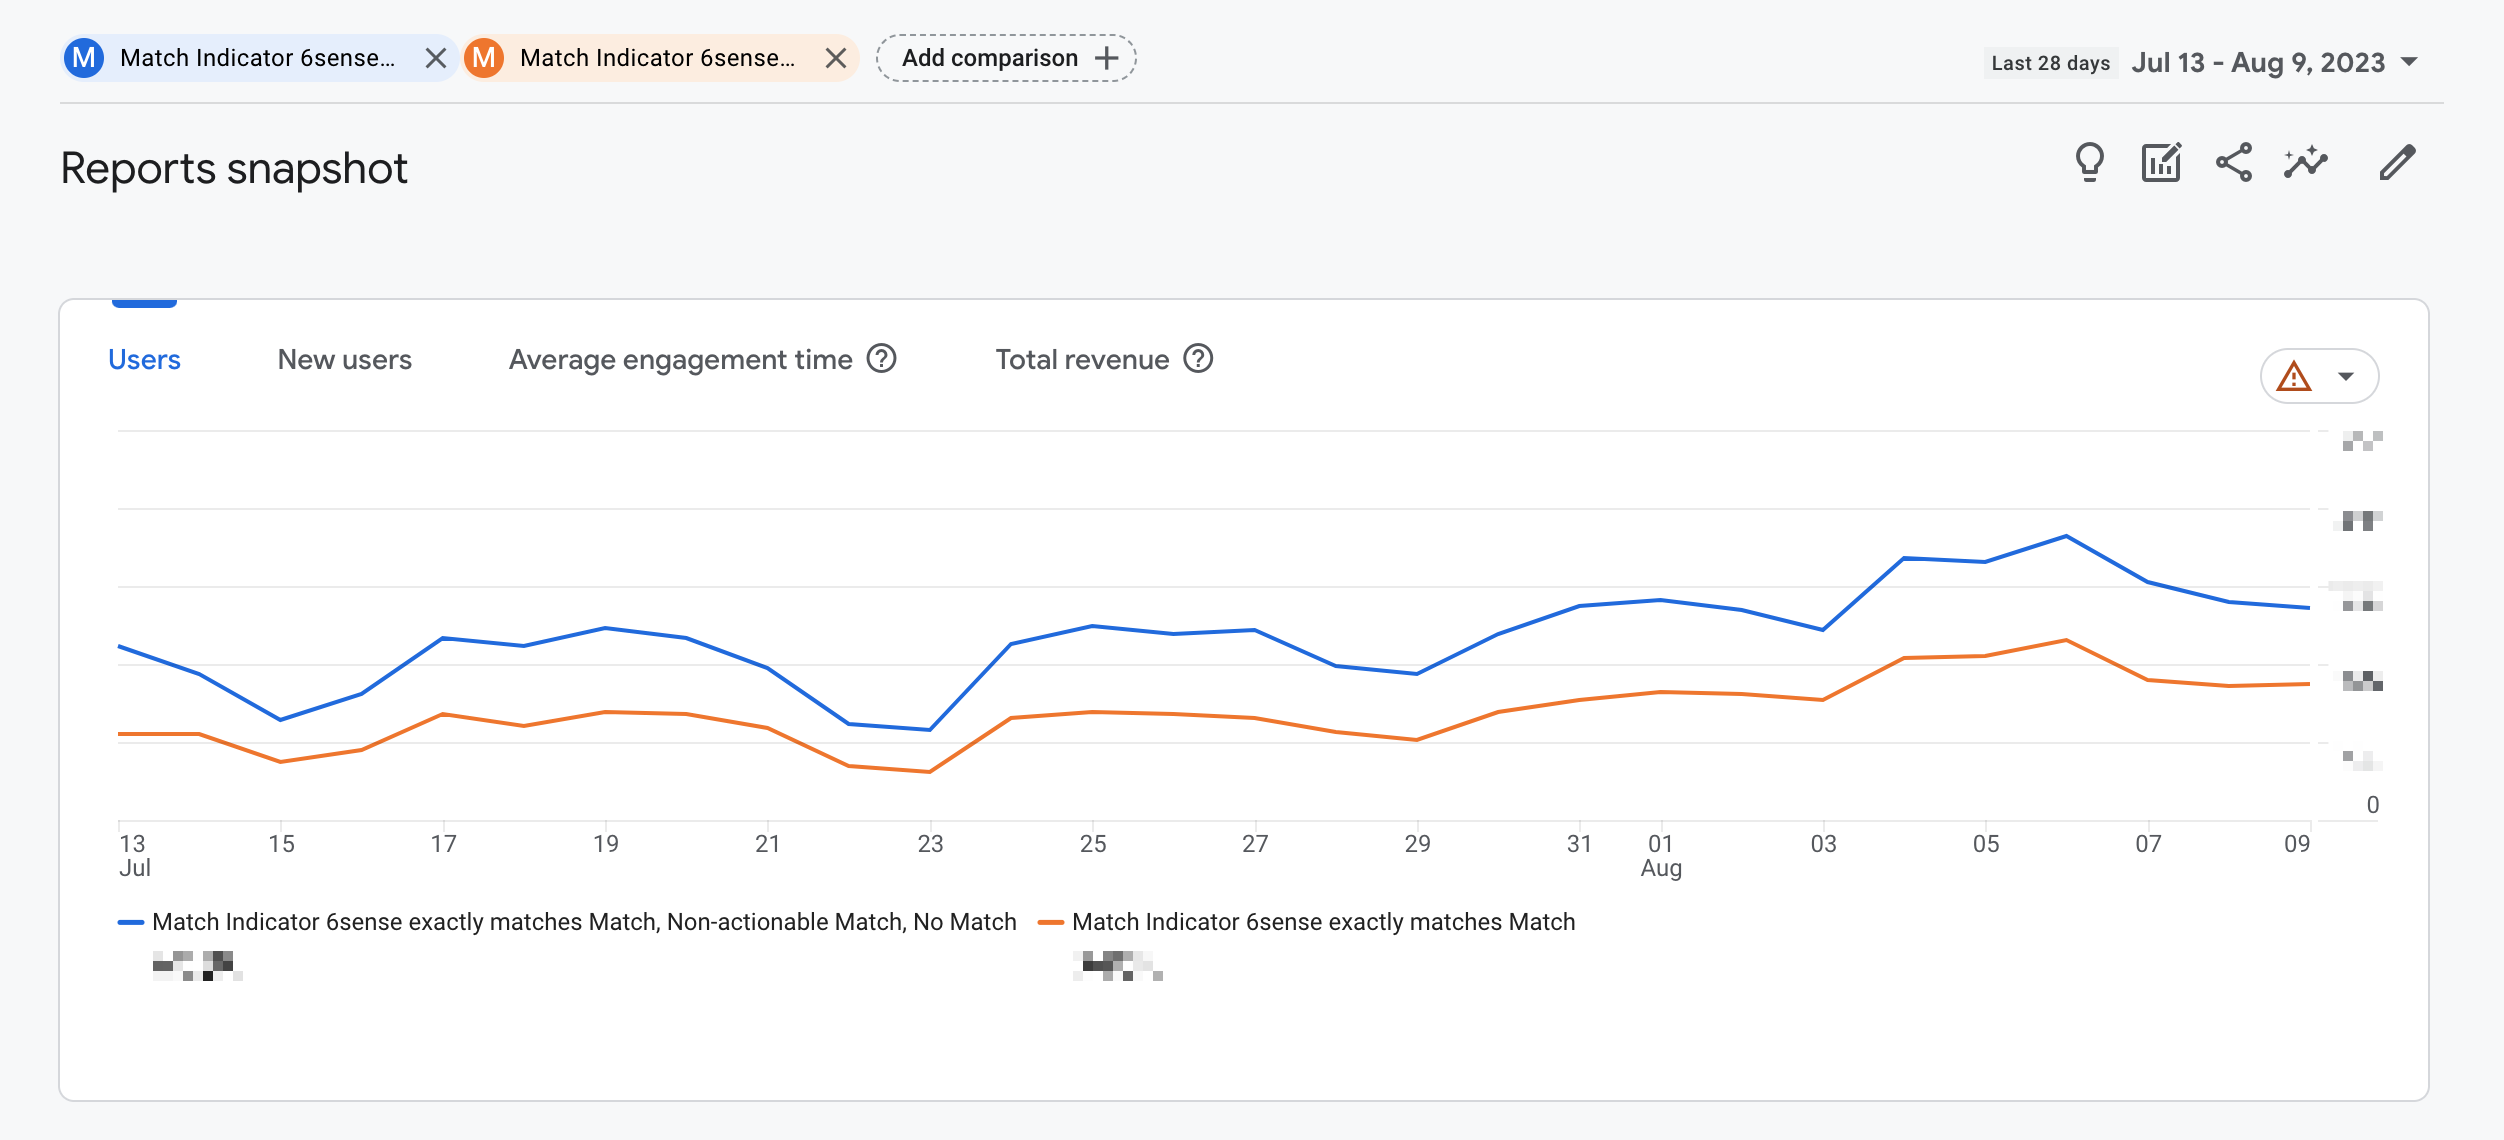
Using the 6sense Custom Dimension for "Match Indicator" allows us to target a data point that is always populated. If there is value for this dimension, it means that GA4 properly picked up the 6sense data and the visitor was on the page long enough for this to happen.
Then comparing it to another Comparison for when a "Match" occurs, we can see that the ratio is much closer to the expectation.
Please note: The above comparison is not going to be an exact match to the Pageview Match Rate report in 6sense. In 6sense, we exclude "invalid pageviews" from the calculation to control for non-actionable web traffic like crawlers and bots. You can learn more about why in the Pageview Match Rates article here!
In conclusion
GA4 has limited the ability to granularly use the 6sense data in reports while also being able to sync Segments to AdWords. However, hopefully this guide allows you to understand these limitations and adjust your reporting methodology to use Comparisons and Audiences instead.
Comments
-
@AlanStrahinic Thanks for sharing!! 👏
2 -
Absolutely phenomenal, @AlanStrahinic.
3 -
@AlanStrahinic , this is incredible! I love how straightforward the explanation is, there is a lot of value here.
Any chance you could put this on a PDF resource I can share with my team?
3 -
@kbaudour Good idea! I've just created it and updated the post above with the download link.
7 -
Thank you for this explanation! Are there instructions to create the Match Indicator dimensions? Edit: Looks like I named that dimension "company match". I'll be able to use that.
2 -
@AlanStrahinic I have the same question as Vinny above. How would you go about creating the Match Indictor dimension and its values?
1 -
@AlanStrahinic I believe the data layer variable is called company_match_6si that be can used. It gives the result of "Non-actionable Match" for visit lacking company information.
2 -
Hi @Vinny @Andrew Backman , thank you for the question!
Vinny, you are correct.
company_match_6siis the correct data layer variable. For this, and others, you can reference the table here: https://support.6sense.com/knowledge-base/11867180025747-install-the-company-details-api-on-google-tag-manager-6sense-webtag-v2-0/#2c-create-variables-in-gtmYou can find
company_match_6sion the 23rd row.1 -
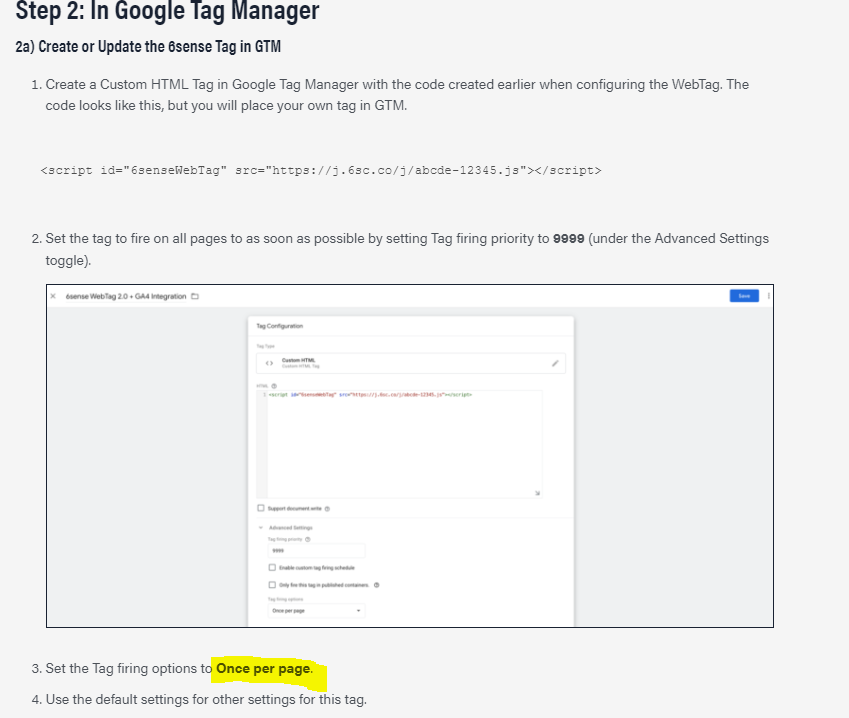
@AlanStrahinic Quick question. For your set up of the web tag 2.0. Do you recommend we have it firing once per page or once per event because I am seeing in two different documentations one says once per event? I see in two different documents one says once per page and one says once per event in screenshots.
 0
0 -
@Andrew Backman Good catch! We'll get this fixed. The correct setting is "Once per Page".
1 -
Thanks for confirming! @AlanStrahinic
1


Categories
- All Categories
- 20 Maturity Model
- 5 Groundwork Use Case Playbooks
- 7 Transform Use Case Playbooks
- 6 Maximize Use Case Playbooks
- 1 Roadmap
- 1 Crossword
- 734 All Discussions
- 55 Product Updates
- 61 6th Street
- 12 Welcome
- 4 Administrator Certification
- 3 Sales Certification
- 10 Advertising Certification
- 10 Demand Gen Plays
- 21 Reporting HQ
- Business Value Assessment (BVA)
- 38 AI Email
- 3 What is CE
- 8 Getting Started with CE
- 16 Thriving with CE
- 6 Conversation Starters
- 203 Job Board
- 34 General
- 11 Partner Place
- 200 Research Road
- Compensation Calculator
- 79 Sales
- 14 Pipeline Generation Tuesdays
- 20 BDR Block
- 11 SKO Supplies
- 7 Advice
- 2 Assets
- 20 Verticals
- 10 Manufacturing, Logistics & Supply Chain
- 8 Financial Services
- search-results
- 291 Events
- 12 6sense Quarterly Product Update (Recordings)
- 26 Customer Story Hour (Recordings)