Metric Monday: Buying Experience Key Findings by Purchase Cost


Hi all,
Toward the end of our 2024 Buyer Experience Report (starting on page 56), you’ll find detailed breakdowns of the data, including key buying journey stats by purchase cost.
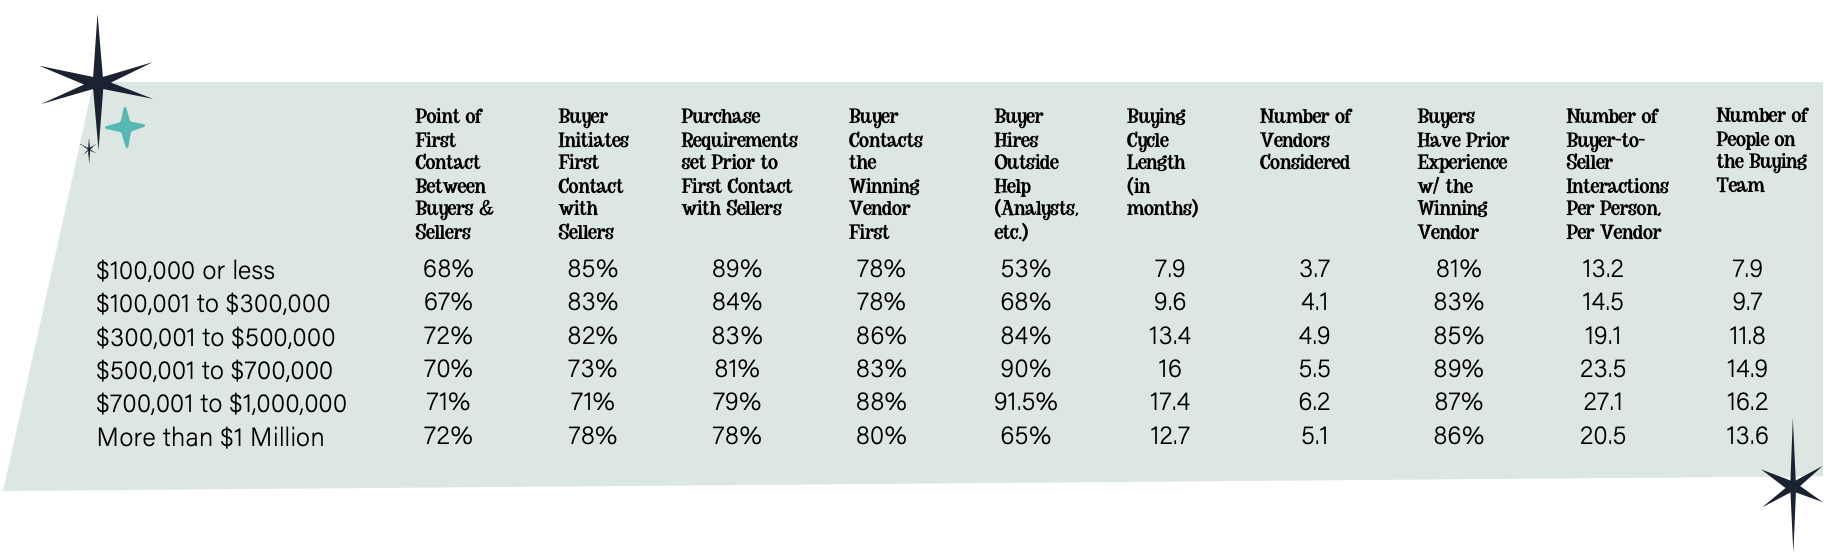
We’ll soon be publishing an article dedicated to this table, but for now, here’s a preview of the numbers organized by deal size. Generally, as purchase costs rise, buying teams evaluate more vendors, team sizes grow, interactions with vendors increase, and buying cycles lengthen. Simply put, the bigger the purchase, the more complex the buying process becomes (with the exception of the most costly deals, interestingly). Yet, regardless of deal size, buyers still delay engaging sellers until they’re over two-thirds of the way through their journey.
In 71% to 85% of cases, buyers initiate contact. For 78% to 89% of purchases, buyers have fully or mostly established their requirements before involving sellers. And most strikingly, buyers rank their shortlist, reach out to their top choice first, and end up purchasing from that vendor in 78% to 88% of deals, across purchase costs.
Categories
- All Categories
- 20 Maturity Model
- 5 Groundwork Use Case Playbooks
- 7 Transform Use Case Playbooks
- 6 Maximize Use Case Playbooks
- 1 Roadmap
- 1 Crossword
- 734 All Discussions
- 56 Product Updates
- 61 6th Street
- 12 Welcome
- 4 Administrator Certification
- 3 Sales Certification
- 10 Advertising Certification
- 10 Demand Gen Plays
- 21 Reporting HQ
- Business Value Assessment (BVA)
- 38 AI Email
- 3 What is CE
- 8 Getting Started with CE
- 16 Thriving with CE
- 6 Conversation Starters
- 204 Job Board
- 34 General
- 11 Partner Place
- 202 Research Road
- Compensation Calculator
- 79 Sales
- 14 Pipeline Generation Tuesdays
- 20 BDR Block
- 11 SKO Supplies
- 7 Advice
- 2 Assets
- 20 Verticals
- 10 Manufacturing, Logistics & Supply Chain
- 8 Financial Services
- search-results
- 293 Events
- 12 6sense Quarterly Product Update (Recordings)
- 26 Customer Story Hour (Recordings)