Using the Usage Report

Dave DiMillo
Posts: 23 
The Usage Report allows an administrator to visualize and analyze the company’s usage of 6sense. Refer to the Usage Metrics page for full details surrounding the report.
Key Report Metrics
- Users per month
- Logins per month
- Sales Intelligence Adoption
- Segments created per month
- Segments in use per month
- 6sense Campaign Spend per month
- Accounts targeted and reached per month
- Downloads with details support for most metrics
Use Case Summary
- Report on the number and IDs of platform logins
- Report how many times Segments were used
Report on the number and IDs of 6sense logins
- Go to the Usage Report by selecting Reports from the left hand nav bar and then select View Report in the Usage box under Administrator Reports.
- Platform Logins is shown under the User Metrics tab. Select the period on which you would like to report.
- The number of logins for the period selected is shown above the bar graph. 958 user logins in the example below.
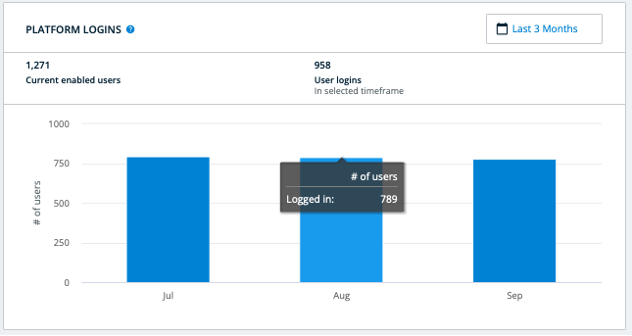
- Mouse-over a bar in the graph to see logins for that month. 789 logins were recorded in the month of August in the image above.
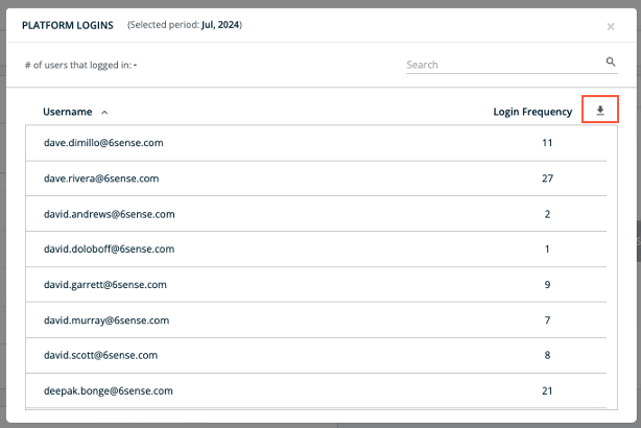
- Click on a bar in the graph to see a pop-up with the usernames of the people who have logged in. Select the download icon to get a spreadsheet of the users and their login frequencies.
Report how many times Segments were used
- Go to the Usage Report by selecting Reports from the left hand nav bar and then select View Report in the Usage box under Administrator Reports.
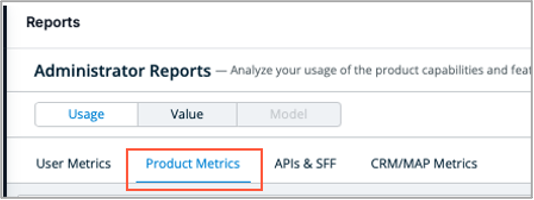
- Select Product Metrics near the top of the report to the right of User Metrics.
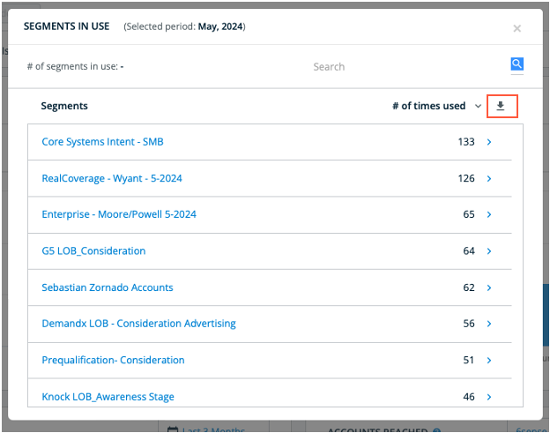
- Go to the Segments in Use box and select a reporting time period. The number of segments in use for the period selected will be shown above the bar graph. 1,408 segments were in use during the period selected in the example below. Mouse-over the bar for a specific month to see details.
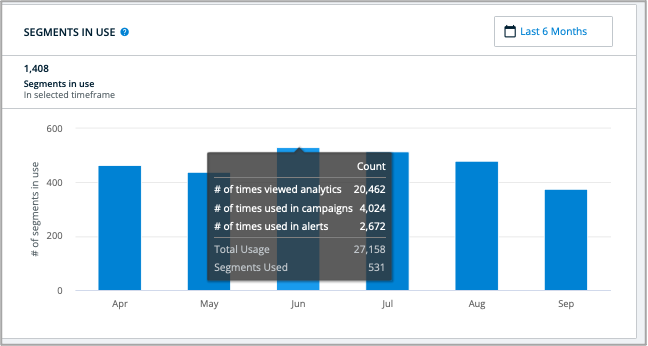
- Click on a bar in the chart to see the segments in use for the month selected. Click the download icon for a spreadsheet of segment names, IDs and the times used.
Tagged:
2
Comments
-
How do we save these to a saved report? Revvy is suggesting there should be a checkbox, ellipsis or drag and drop feature for us to save a report with the specific usage metrics we're interested in so we don't have to scroll down the full page each time. We haven't had success figuring this out…every time we try to create a new report within a saved reports folder as well, it doesn't save within the folder and we redo the navigation each time.
0

Categories
- All Categories
- 1 RevvyAI
- 22 Maturity Model
- 6 Groundwork Use Case Playbooks
- 7 Transform Use Case Playbooks
- 6 Maximize Use Case Playbooks
- 1 Roadmap
- 1 Crossword
- 761 All Discussions
- 63 Product Updates
- 61 6th Street
- 12 Welcome
- 4 Administrator Certification
- 2 Sales Certification
- 4 Advertising Certification
- 11 Demand Gen Plays
- 23 Reporting HQ
- Business Value Assessment (BVA)
- 46 AI Email
- 2 What is AI Email?
- 8 AI Email Use Cases
- 16 Thriving with AI Email
- 6 Conversation Starters
- 231 Job Board
- 34 General
- 11 Partner Place
- 237 Research Road
- Compensation Calculator
- 79 Sales
- 14 Pipeline Generation Tuesdays
- 19 BDR Block
- 11 SKO Supplies
- 7 Advice
- 2 Assets
- 19 Verticals
- 10 Manufacturing, Logistics & Supply Chain
- 7 Financial Services
- search-results
- 300 Events
- 54 Inspire UK
- 8 Inspire 26
- 11 Inspire 24
- 12 6sense Quarterly Product Update (Recordings)
- 26 Customer Story Hour (Recordings)