By Popular Demand: Our SFDC Pipeline Dashboard Details 🎉


Hi All!
I recently hosted a 6th Street Live session about all things related to reporting and analytics. We spoke about the importance of a single source of truth for top line Marketing performance metrics across the Revenue team, and ensuring the metrics are provided quickly (real-time if possible) and in-context to a goal or previous trends. You can catch a recording of that session here.
Our SFDC dashboard was shared and discussed at length, and many customers were interested in building their own version of it. You asked for details behind some of the specific fields we use in SFDC to build that dashboard. Please note a lot of this will be very specific to your own implementation of SFDC but here’s what we have:
General Data Points:
- Accounts are tagged as belonging to one of our GTM segments (Commercial, Enterprise, Strategic) to allow us to filter to view each slice of our business
- Opportunities are tagged as New Business or Upsell by reps at the time they are created so that we can view performance by each motion
- 6QA Date: This is a 6sense datapoint of the timestamp when an account becomes a 6sense Qualified Account (6QA). 6sense pushes the startdate and end date of the 6QA onto the account record. This allows us to view a trend of 6QAs month over month
Conversion Rates:
- 6QA to Stage 0 Opportunity: We have a custom field on the account record that populates when that account converts to an opportunity during an active 6QA. We populate a value of 1, so that we can easily sum that value up in a formula and divide it by total number of 6QA to get a conversion rate.
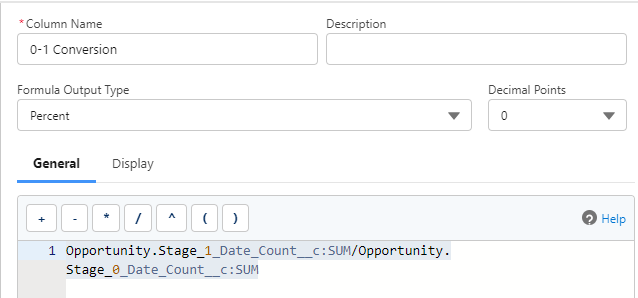
- Stage 0 opp to Stage 1, Stage 1 to Stage 2 etc.: We have custom fields on the opportunity record that populate a 1 when an account hits a specific stage e.g. when an opportunity moves from Stage 0 to Stage 1 we populate a 1 in that field. We then use formulas in opportunity reports that pull from these custom fields to calculate conversion. Here's an example
Velocity:
We track the number of days it takes from an account to move from one stage to the next and stamp those on the opportunity records. Eg. When an opportunity moves from S1 to S2 the:
- "S2 Date" is recorded so we can trend volume of S2 opps by month
- Number of days that the opp was in S1 is stamped. This is a numeric field that we can take an average of to get velocity metrics on how many days it's taking on average for an opportunity to move from S1 to S2
Comments
-
🙌 oh yes!
1 -
Amazing! 🔥
0 -
Thank you for posting @Saima! This was an awesome session and I'm sending this link to everyone I know 😀
2 -
@Sara Bush thought you might find this interesting!
2 -
@Saima Are there any more details I would need to provide our operations team to have them help me build this out? Or would you say they should be able to do it with the info provided here and a video/picture of the end result?
0 -
Hi All, Jo Wright from our Agency Partnerships team! We have a number of Top Tier certified partners who are well versed in these dashboards and ready to help with standardised packages. Please do feel free to reach out to me (On here or at jo.wright@6sense.com) if youd like any help from our agency services team!
0


Categories
- All Categories
- 20 Maturity Model
- 5 Groundwork Use Case Playbooks
- 7 Transform Use Case Playbooks
- 6 Maximize Use Case Playbooks
- 1 Roadmap
- 1 Crossword
- 734 All Discussions
- 55 Product Updates
- 61 6th Street
- 12 Welcome
- 4 Administrator Certification
- 3 Sales Certification
- 10 Advertising Certification
- 10 Demand Gen Plays
- 21 Reporting HQ
- Business Value Assessment (BVA)
- 38 AI Email
- 3 What is CE
- 8 Getting Started with CE
- 16 Thriving with CE
- 6 Conversation Starters
- 203 Job Board
- 34 General
- 11 Partner Place
- 200 Research Road
- Compensation Calculator
- 79 Sales
- 14 Pipeline Generation Tuesdays
- 20 BDR Block
- 11 SKO Supplies
- 7 Advice
- 2 Assets
- 20 Verticals
- 10 Manufacturing, Logistics & Supply Chain
- 8 Financial Services
- search-results
- 291 Events
- 12 6sense Quarterly Product Update (Recordings)
- 26 Customer Story Hour (Recordings)