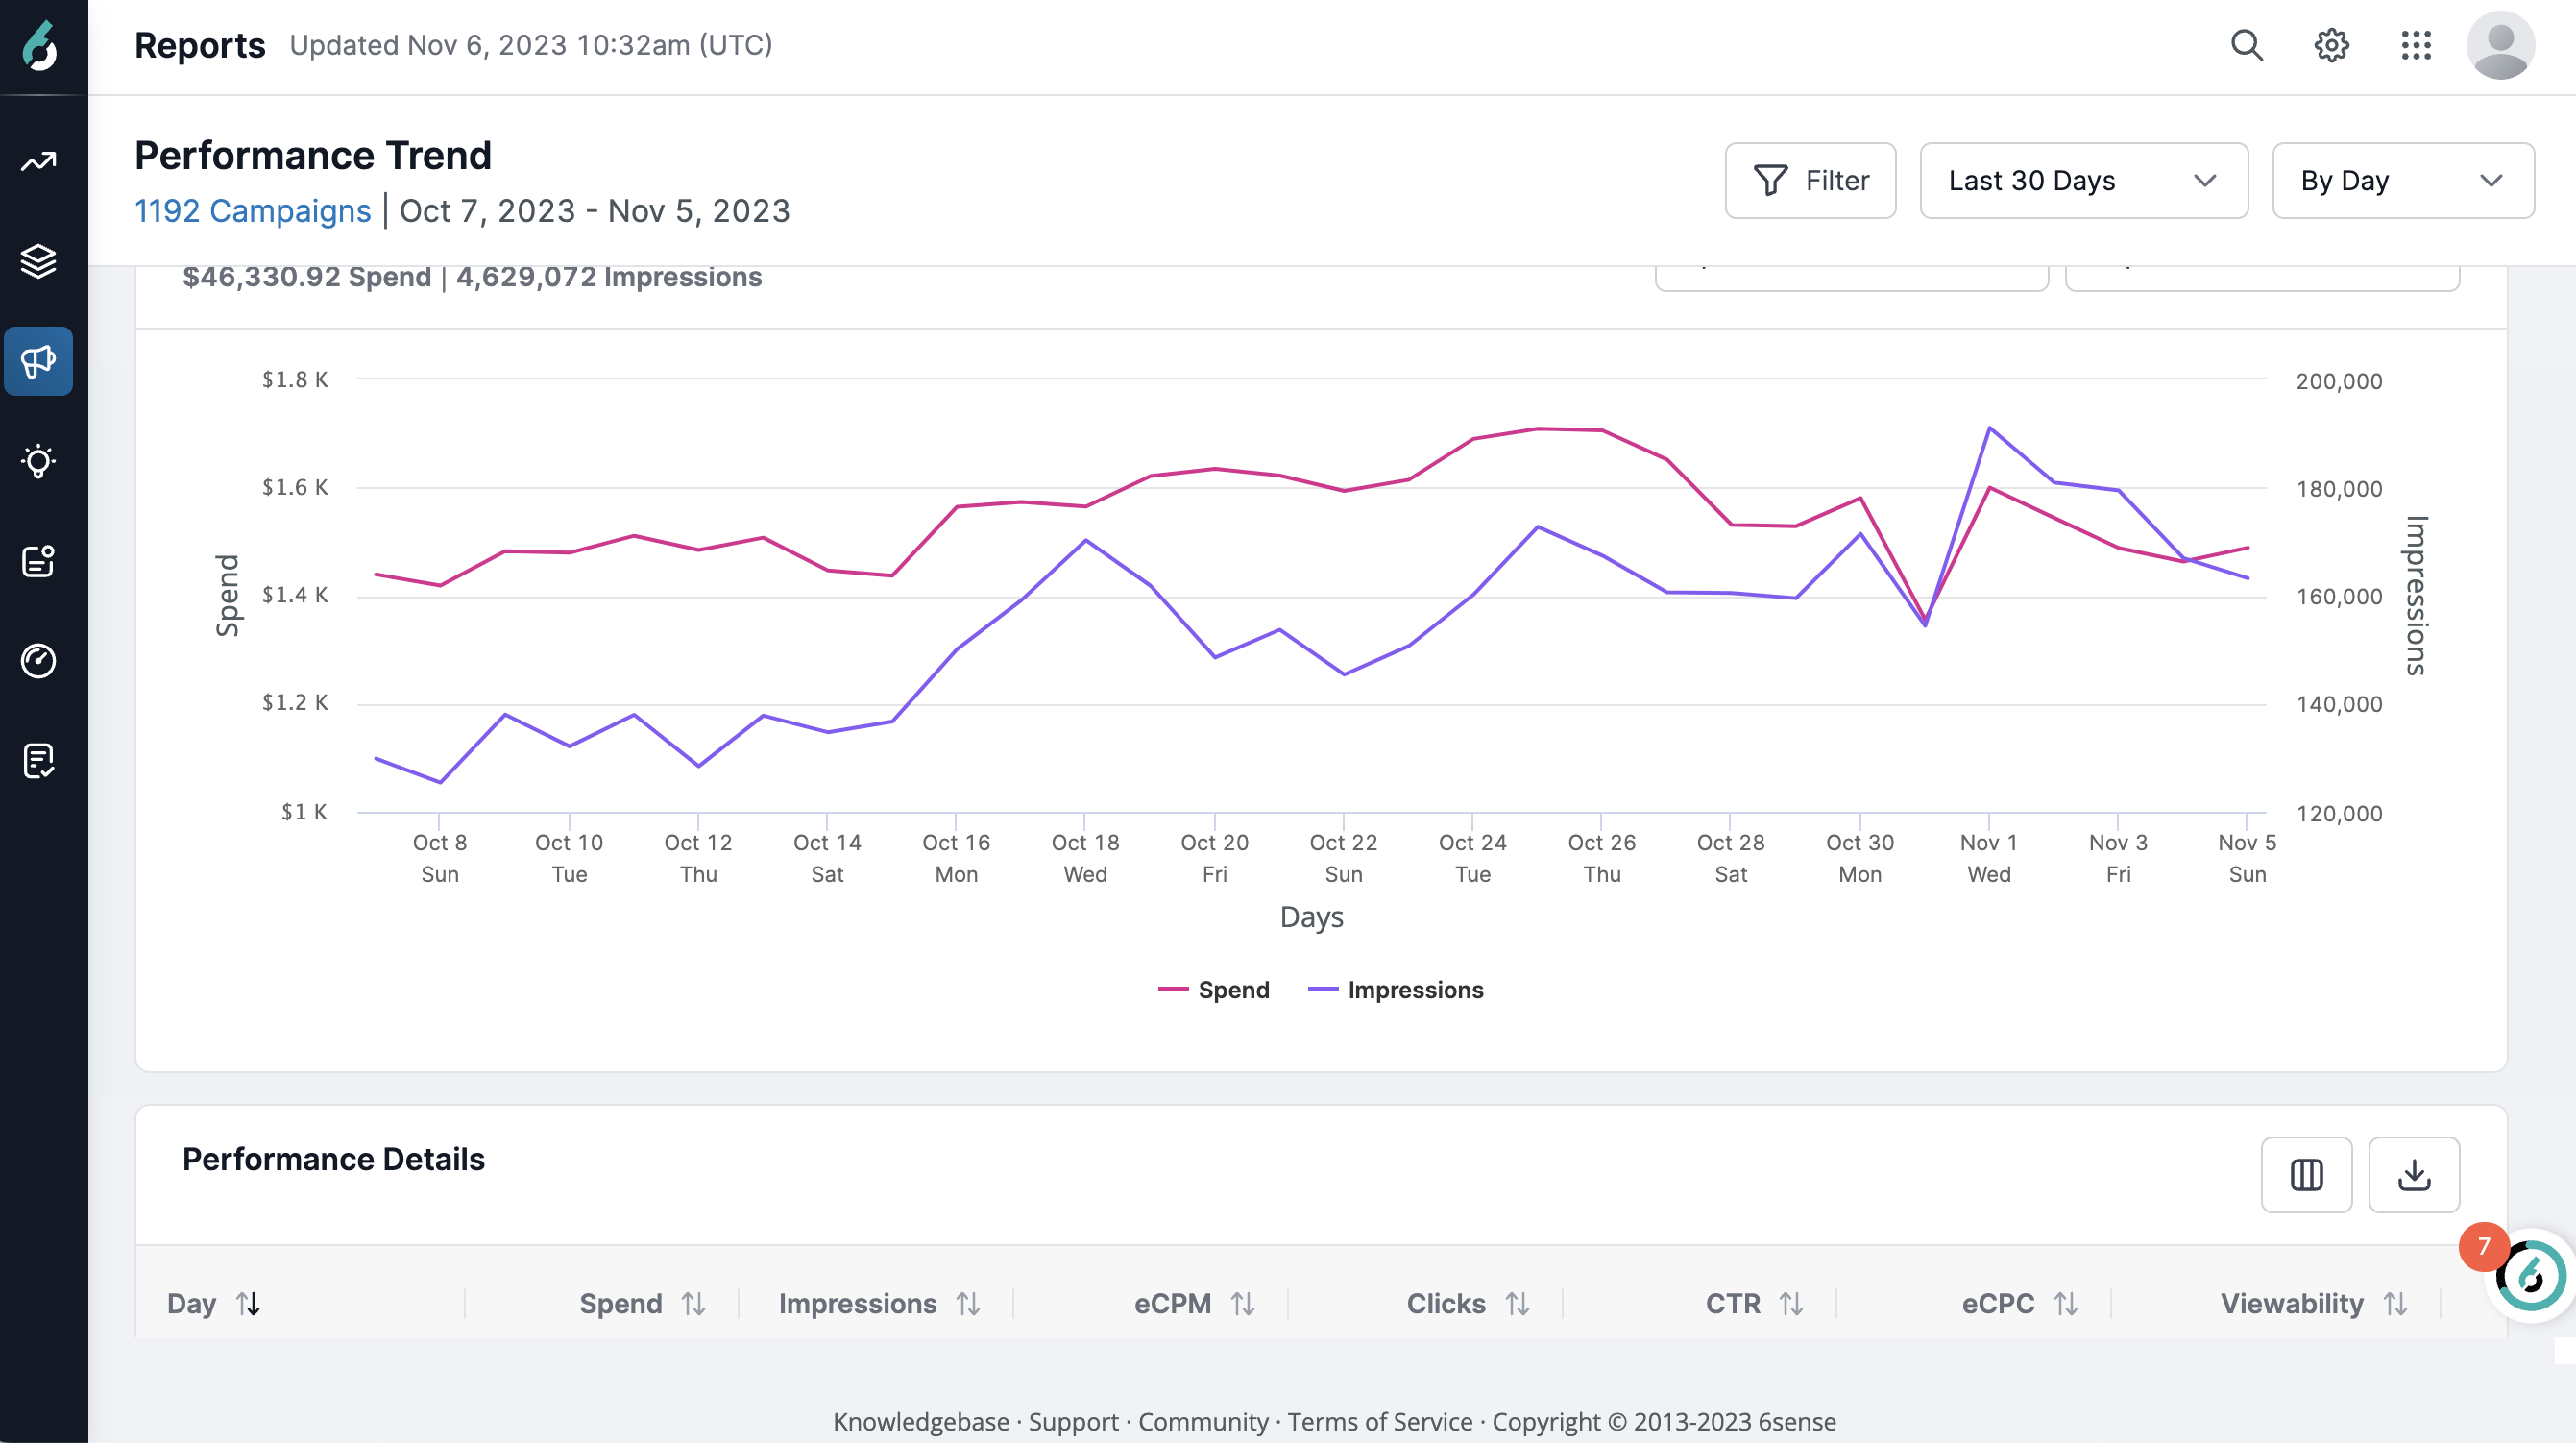
Advertising Performance Trend Report now available


Hey, RevCity! We’re excited to share a new enhancement to our Ads reporting capabilities. Released this week, you can access the Performance Trend Report through the Advertising home page or Reports tab.
Easy-to-use filters and data visualization now make it easy for you to slice campaign performance and reveal insights to quickly understand individual campaigns are performing at varying time intervals – daily, weekly, monthly, or quarterly.
Check it out and let us know how you plan to use the report in your ad strategy!
Comments
-
This is exciting! Thanks for sharing @Raquel Lawrence 🤩
1 -
BEAUTIFUL!!!! 😍
0 -
Awesome.
The filter function is also very practical, for example you can filter through the folder structures by region, topic, etc. depending on the logic according to which the folder structure is organised.
@Raquel Lawrence If the Influenced Pipeline could also be shown here, that would be amazing.
2 -
This report is fantastic! I've been waiting for this for some time!
How can you select specific campaigns to analyze (NAM vs. EMEA)?Do you have recommendations for the two filters to gain fast insights? For instance, spend and impressions appear with similar trends as we would expect. But when you set spend and clicks and the spend decreases while clicks increase this can show a point in time where ad spend was being optimized and ads were receiving more engagement. Do you have examples or best practices to share that can help gain fast insights?
As for future features, it would be awesome to be able to compare specific campaign performance in a visual way for faster insights. Currently, I download the reports and manually assess. It would be excellent to have these insights at our fingertips to quickly determine which campaigns are performing, which ones are not.1 -
For me I find the data interesting but not really useful (yet). I desperately need to be able to look at:
- One campaign at a time with a date filter applied (without having to move each one into a folder)
- How a campaign is performing against a specific model (Product) - without that data it's hard to tell if the campaign is truly performing.
Looking forward to the next iterations. Thanks.
2 -
@Jana_Marketing_Maven Great feedback! You should submit a feature request!
1 -
Great feedback on this thread!
1 -
Is there a future plan to include 6QAs into this graph? Our leading indicator north star will be 6QAs this year.
Ideally, with increased spend we'd want to see an increase in 6QAs. I know 6QAs are not 100% attributed to paid campaigns, but it would be good to see that as spend increases, so does the production of 6QAs, so you know at least paid campaigns are driving engagement to the right accounts.
And then a step further is seeing an option to add pipeline and revenue generation, so we can look at efficiency. With this current graph, you can't understand a holistic view of paid efficiency.
1 -
Tagging @Michael Walter for your question @wdonaldsona!
1 -
Thanks for the tag, Rachel! Nice to meet you @wdonaldsona! I'm the Marketing Insights product manager. This year, we plan to create independent dashboards to track 6QA creation and conversion over time. I would love to talk with you directly to make sure that what we're planning meets your needs. I'll be reaching out to you to find time to talk. Thank you!
2 -
@paruldubey this is the reporting feature we were chatting about!
1


Categories
- All Categories
- 20 Maturity Model
- 5 Groundwork Use Case Playbooks
- 7 Transform Use Case Playbooks
- 6 Maximize Use Case Playbooks
- 1 Roadmap
- 1 Crossword
- 734 All Discussions
- 56 Product Updates
- 61 6th Street
- 12 Welcome
- 4 Administrator Certification
- 3 Sales Certification
- 10 Advertising Certification
- 10 Demand Gen Plays
- 21 Reporting HQ
- Business Value Assessment (BVA)
- 38 AI Email
- 3 What is CE
- 8 Getting Started with CE
- 16 Thriving with CE
- 6 Conversation Starters
- 204 Job Board
- 34 General
- 11 Partner Place
- 202 Research Road
- Compensation Calculator
- 79 Sales
- 14 Pipeline Generation Tuesdays
- 20 BDR Block
- 11 SKO Supplies
- 7 Advice
- 2 Assets
- 20 Verticals
- 10 Manufacturing, Logistics & Supply Chain
- 8 Financial Services
- search-results
- 293 Events
- 12 6sense Quarterly Product Update (Recordings)
- 26 Customer Story Hour (Recordings)